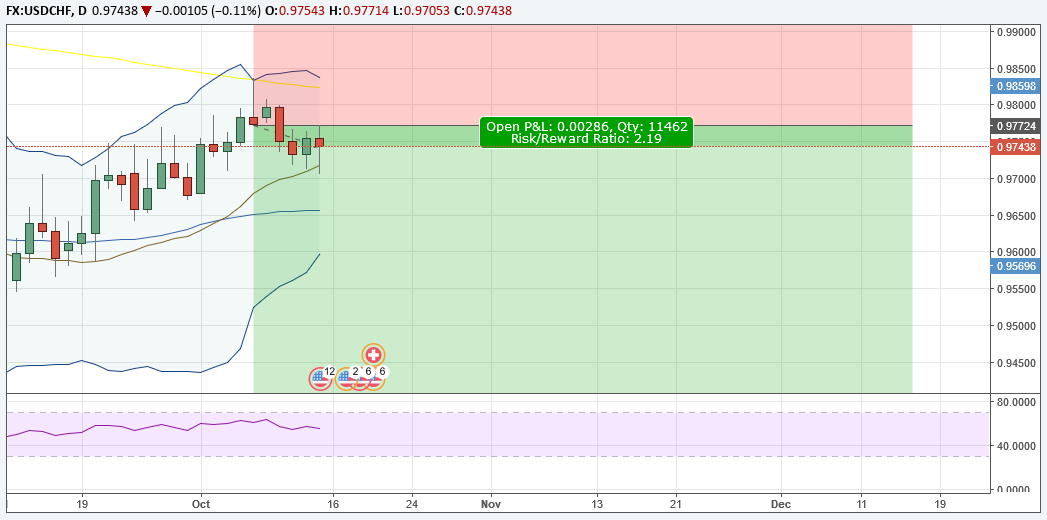
The Relative Strength Index or RSI is an oscillator that is simple and helpful in its application. Oscillators like the RSI help you determine when a currency is overbought or oversold, so a reversal is likely. For those who like to ‘buy low and sell high’, the RSI may be the right indicator for you.

The RSI can be used equally well in trending or ranging markets to locate better entry and exit prices. When markets have no clear direction and are ranging, you can take either buy or sell signals like you see above. When markets are trending, you only want to enter in the direction of the trend when the indicator is recovering from extremes (highlighted above).
Because the RSI is an oscillator, it is plotted with values between 0 and 100. The value of 100 is considered overbought and a reversal to the downside is likely whereas the value of 0 is considered oversold and a reversal to the upside is commonplace. If an uptrend has been discovered, you would want to identify the RSI reversing from readings below 30 or oversold before entering back in the direction of the trend.